
Industry
Data Visualization / Concept Design
Role
Data Visualization Designer
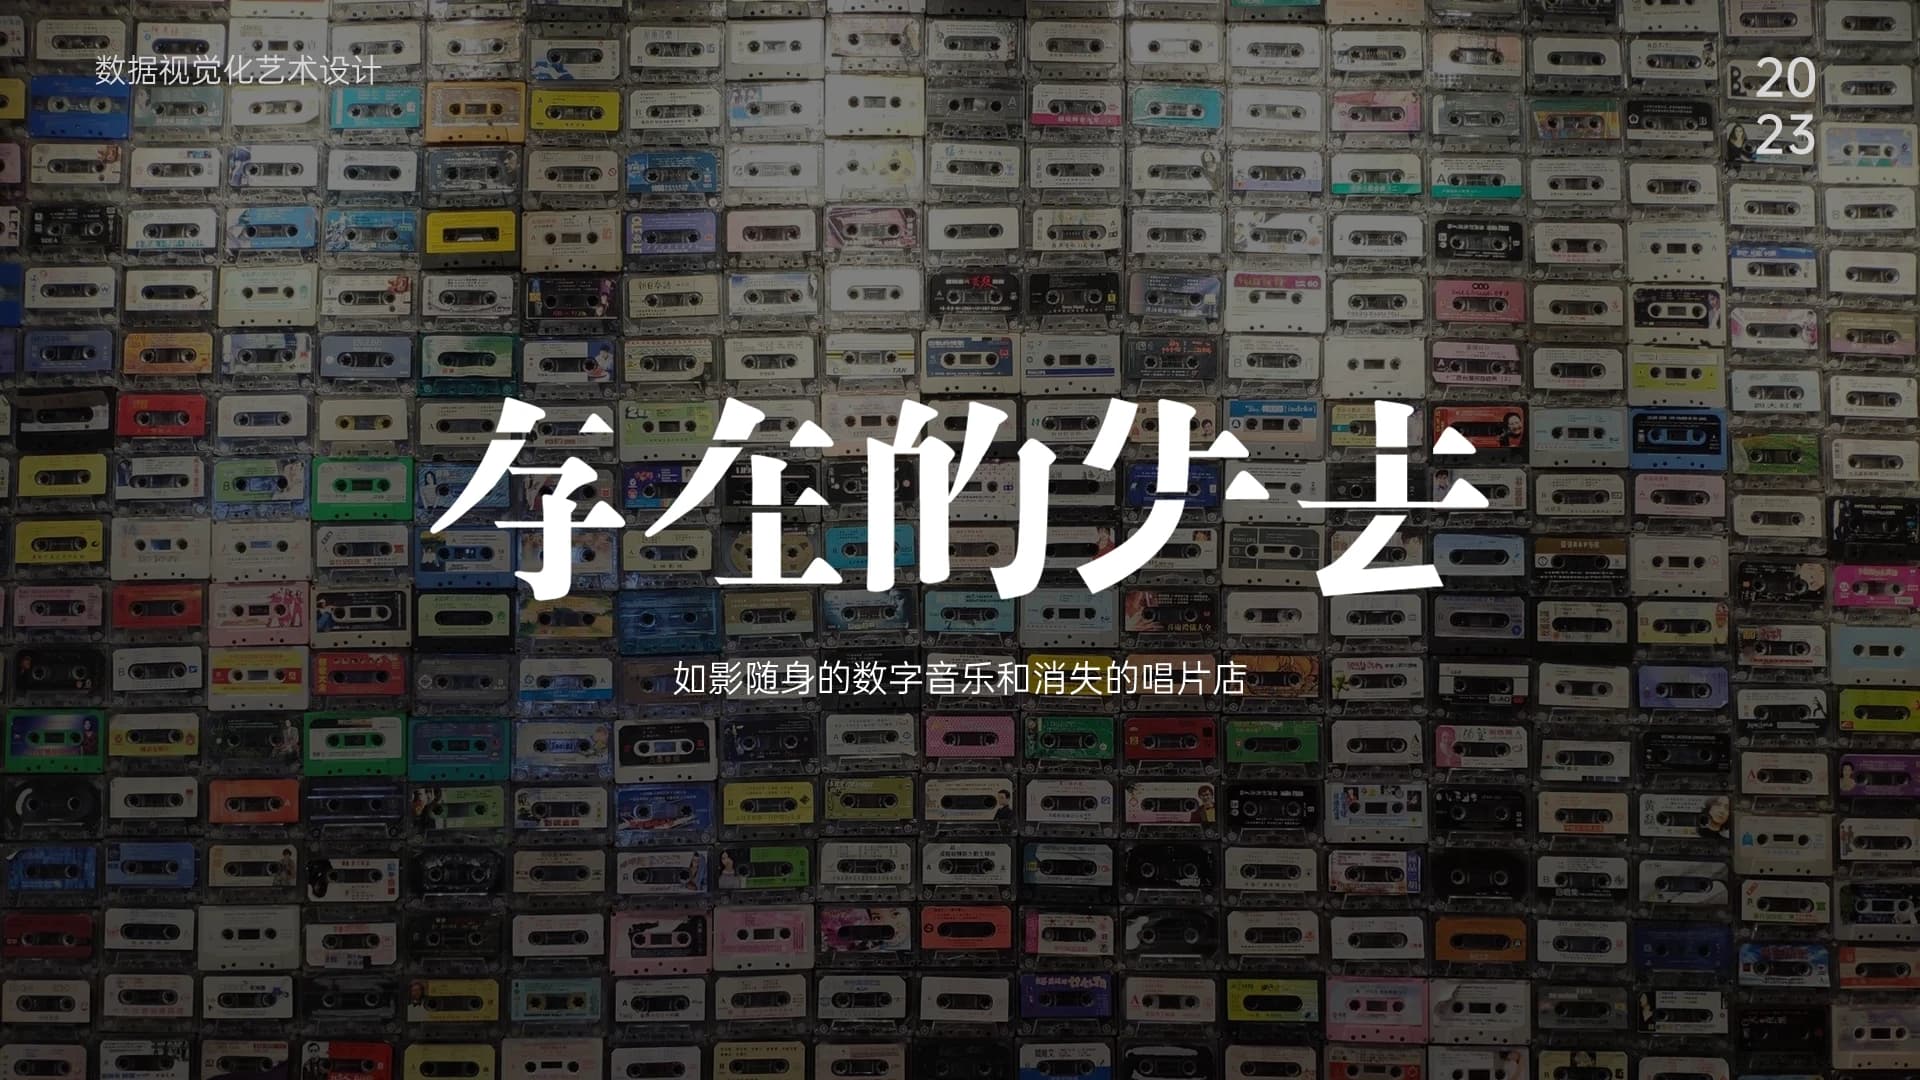
DATA VISUALIZATION ART
Put digital gain and material loss into the same cassette
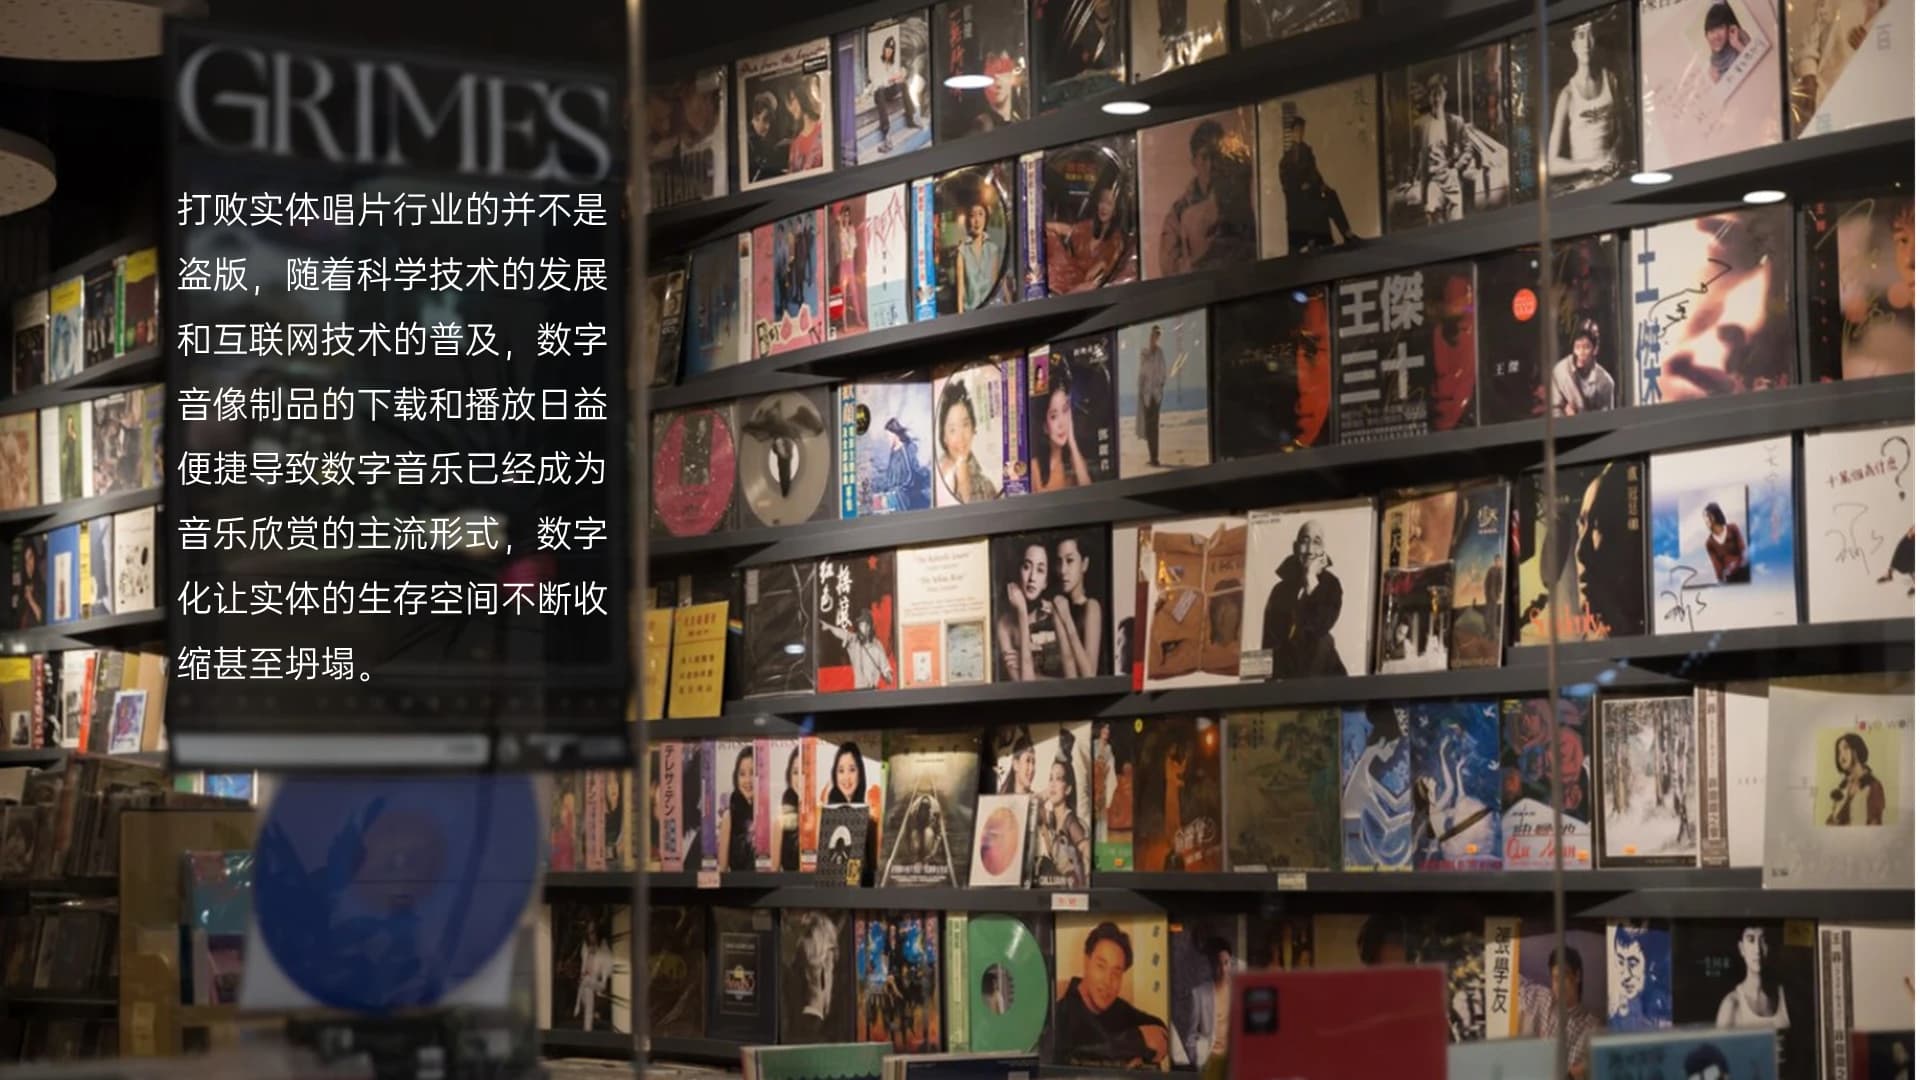
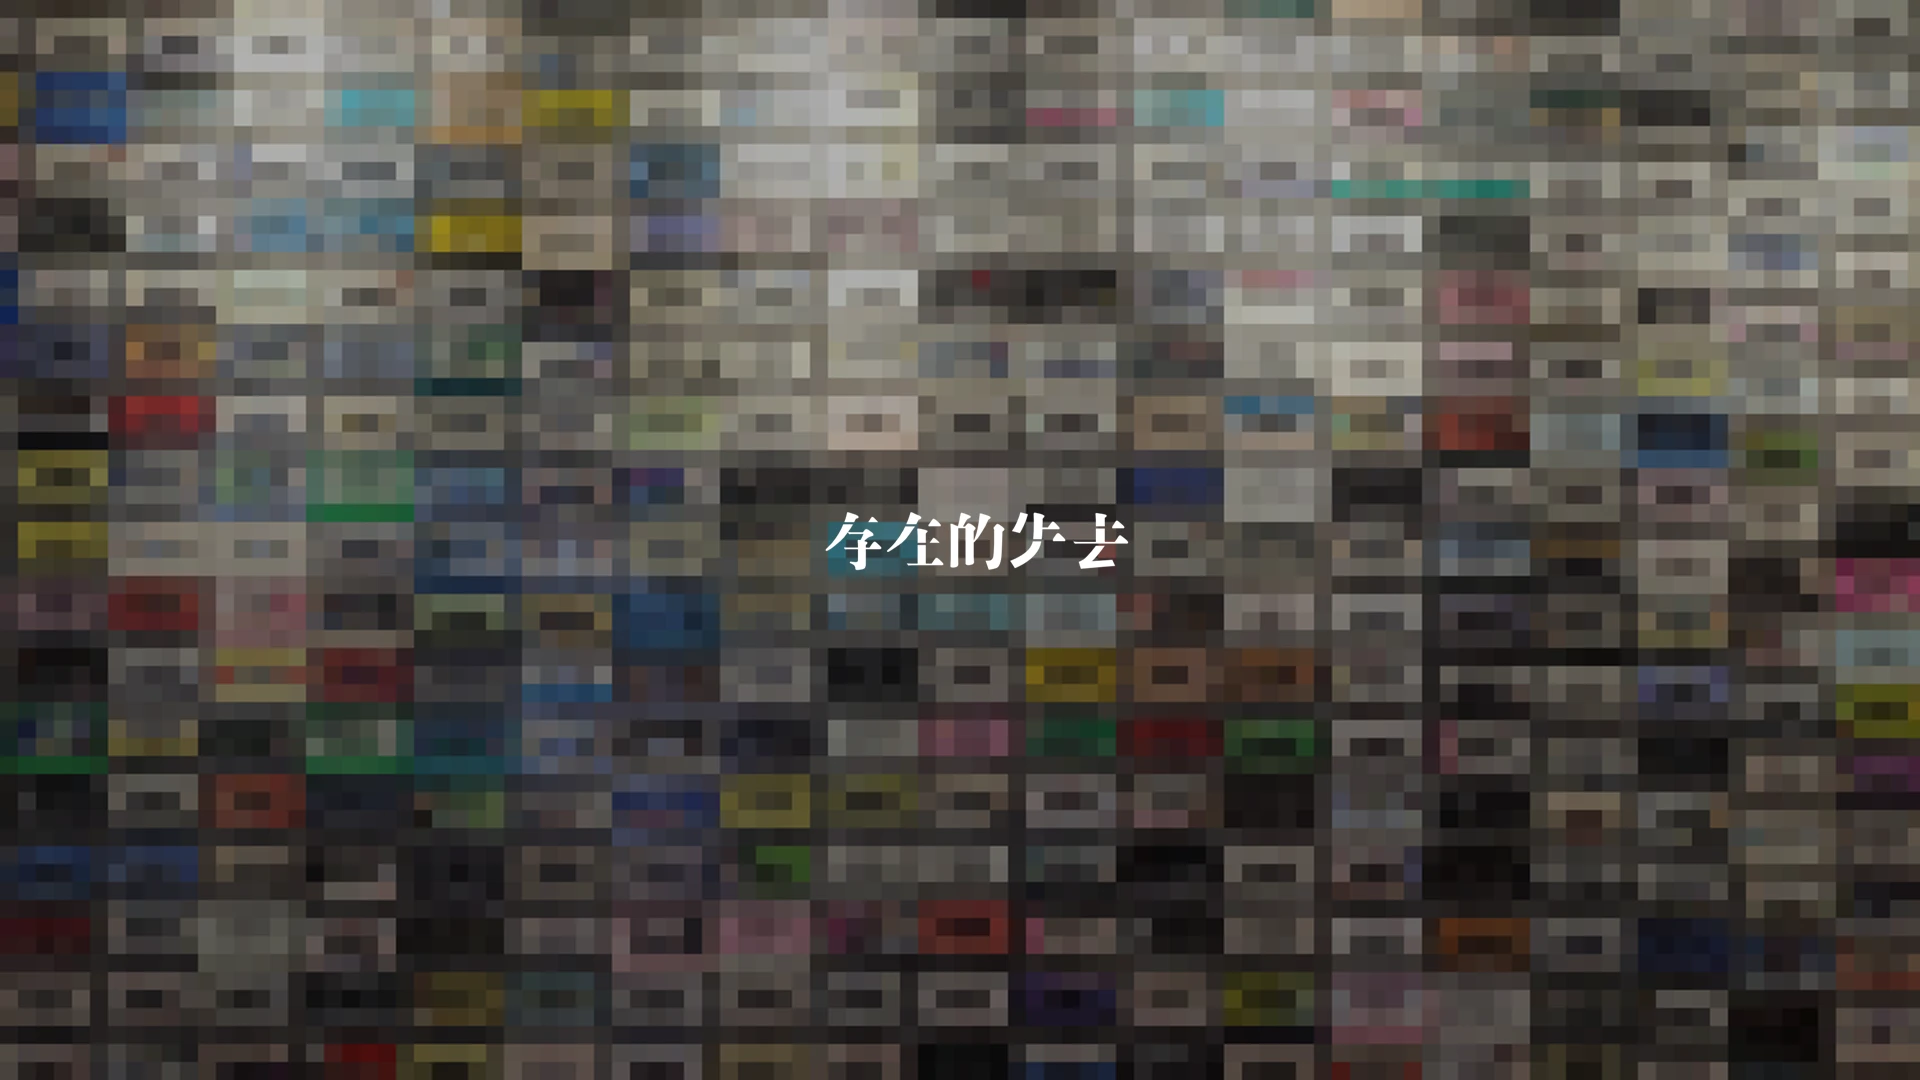
Loss of Existence is a data-visualization art project about material experience in the age of digital music. Music is now instantly available, while record stores, physical albums, cover art, and the simple act of pressing play have gradually left everyday life. The project does not use data only to prove that change; it tries to make that change felt.
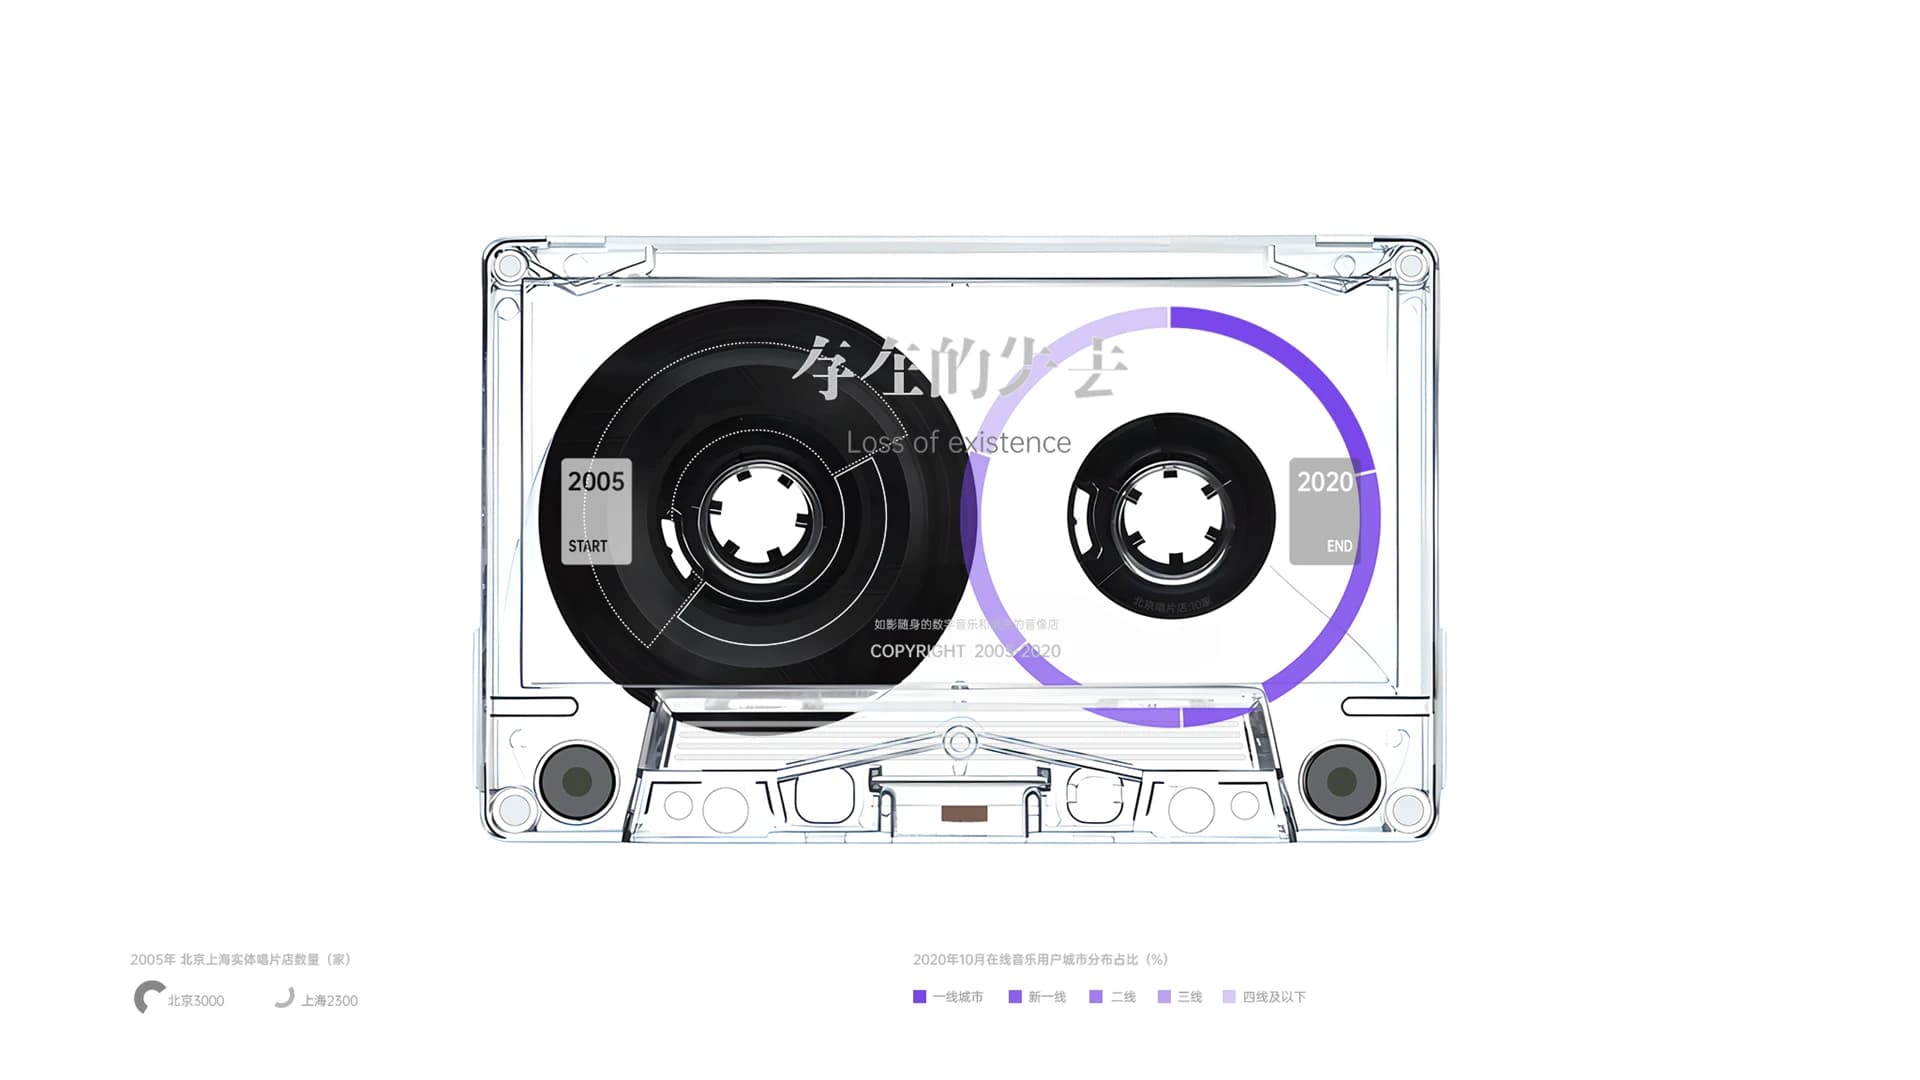
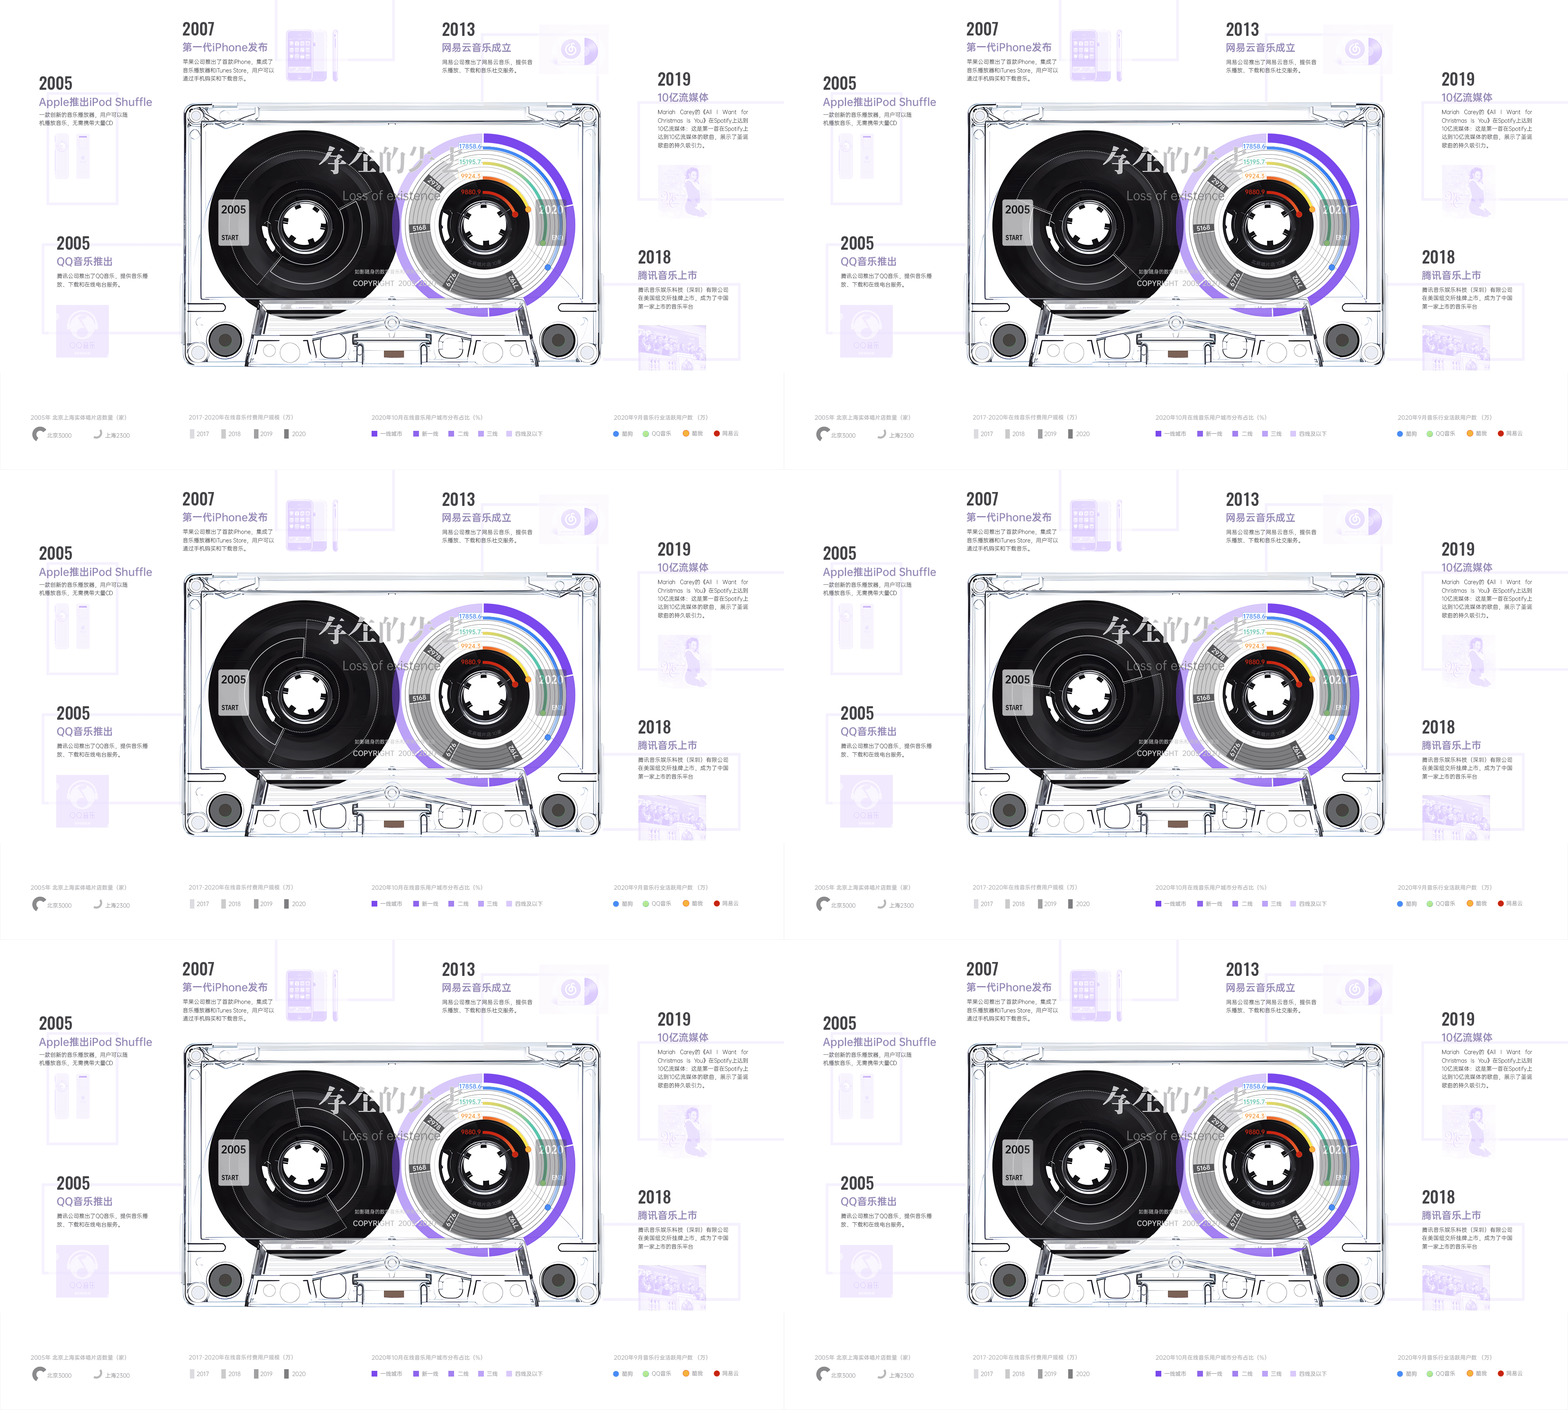
Beginning with the decline of physical music stores and the spread of digital listening, the work uses a transparent cassette as its narrative vessel. One reel retains the weight of physical media; the other is progressively filled by data, platforms, and time. Convenience and loss no longer sit as an abstract contrast in text. They happen within the same object.
01 / MATERIAL PRESENCE
When music loses its physical carrier, more than a format disappears
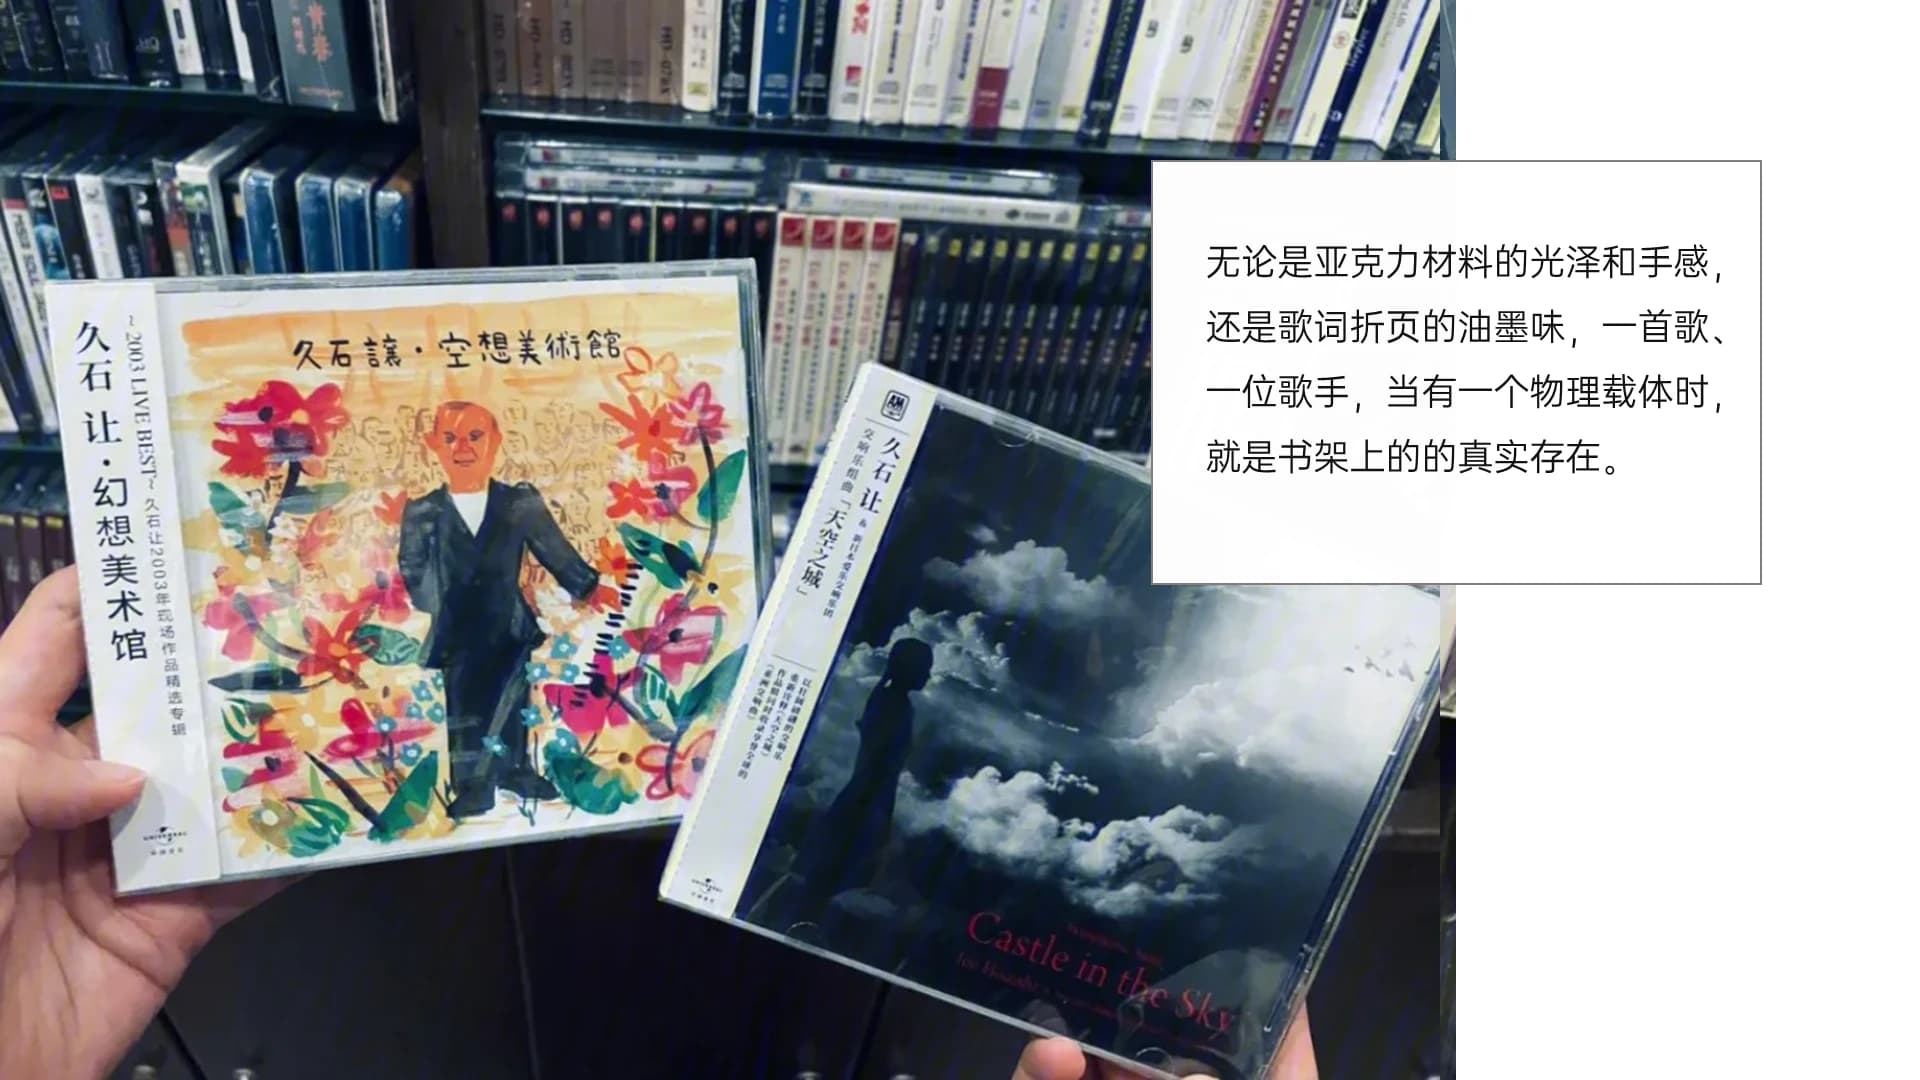
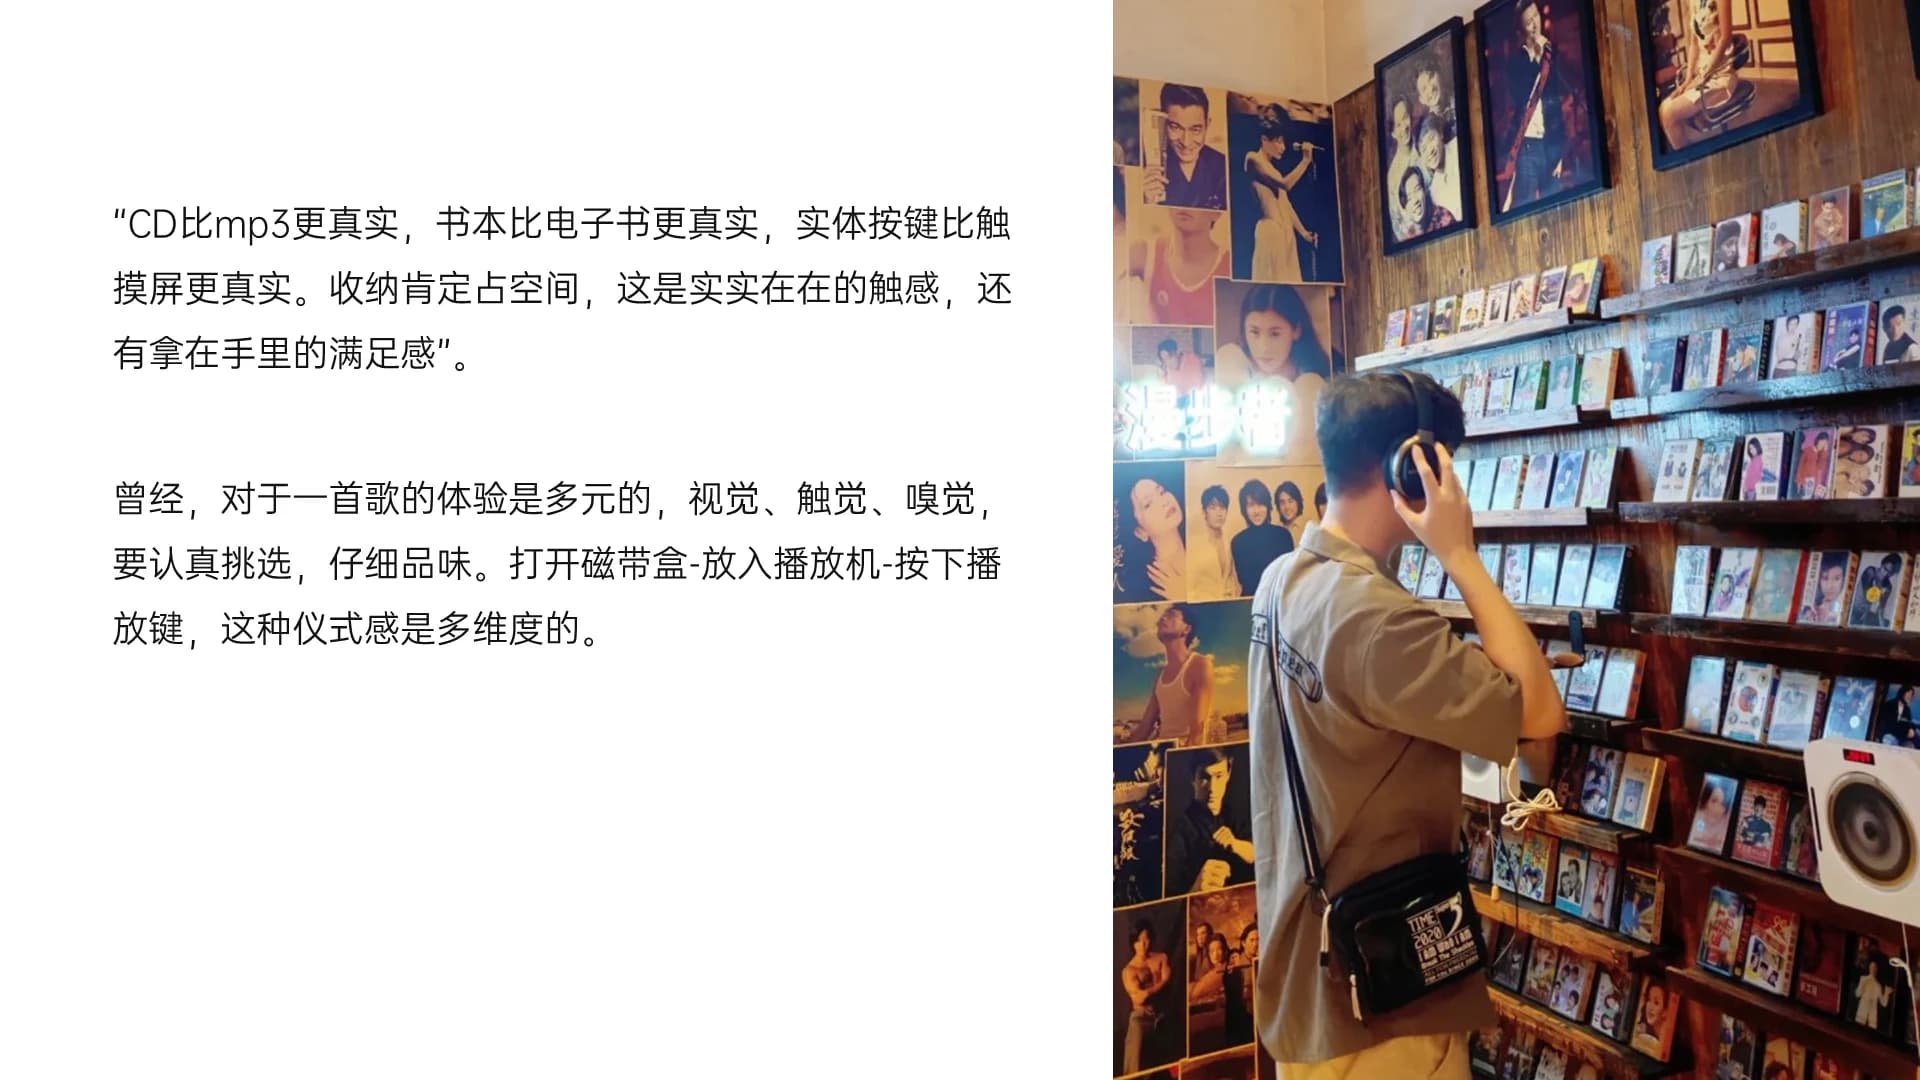
The experience of a physical record is made of small, concrete moments: choosing from a shelf, looking at a sleeve, the sheen of an acrylic case, the smell of printed lyric sheets, and the ritual of loading a tape and pressing a button. Digital listening makes music lighter, faster, and easier to reach, but those textures, spaces, and moments of waiting are no longer preserved in the same way.
02 / DATA EVIDENCE
Confirm the change with data, then let data carry the story
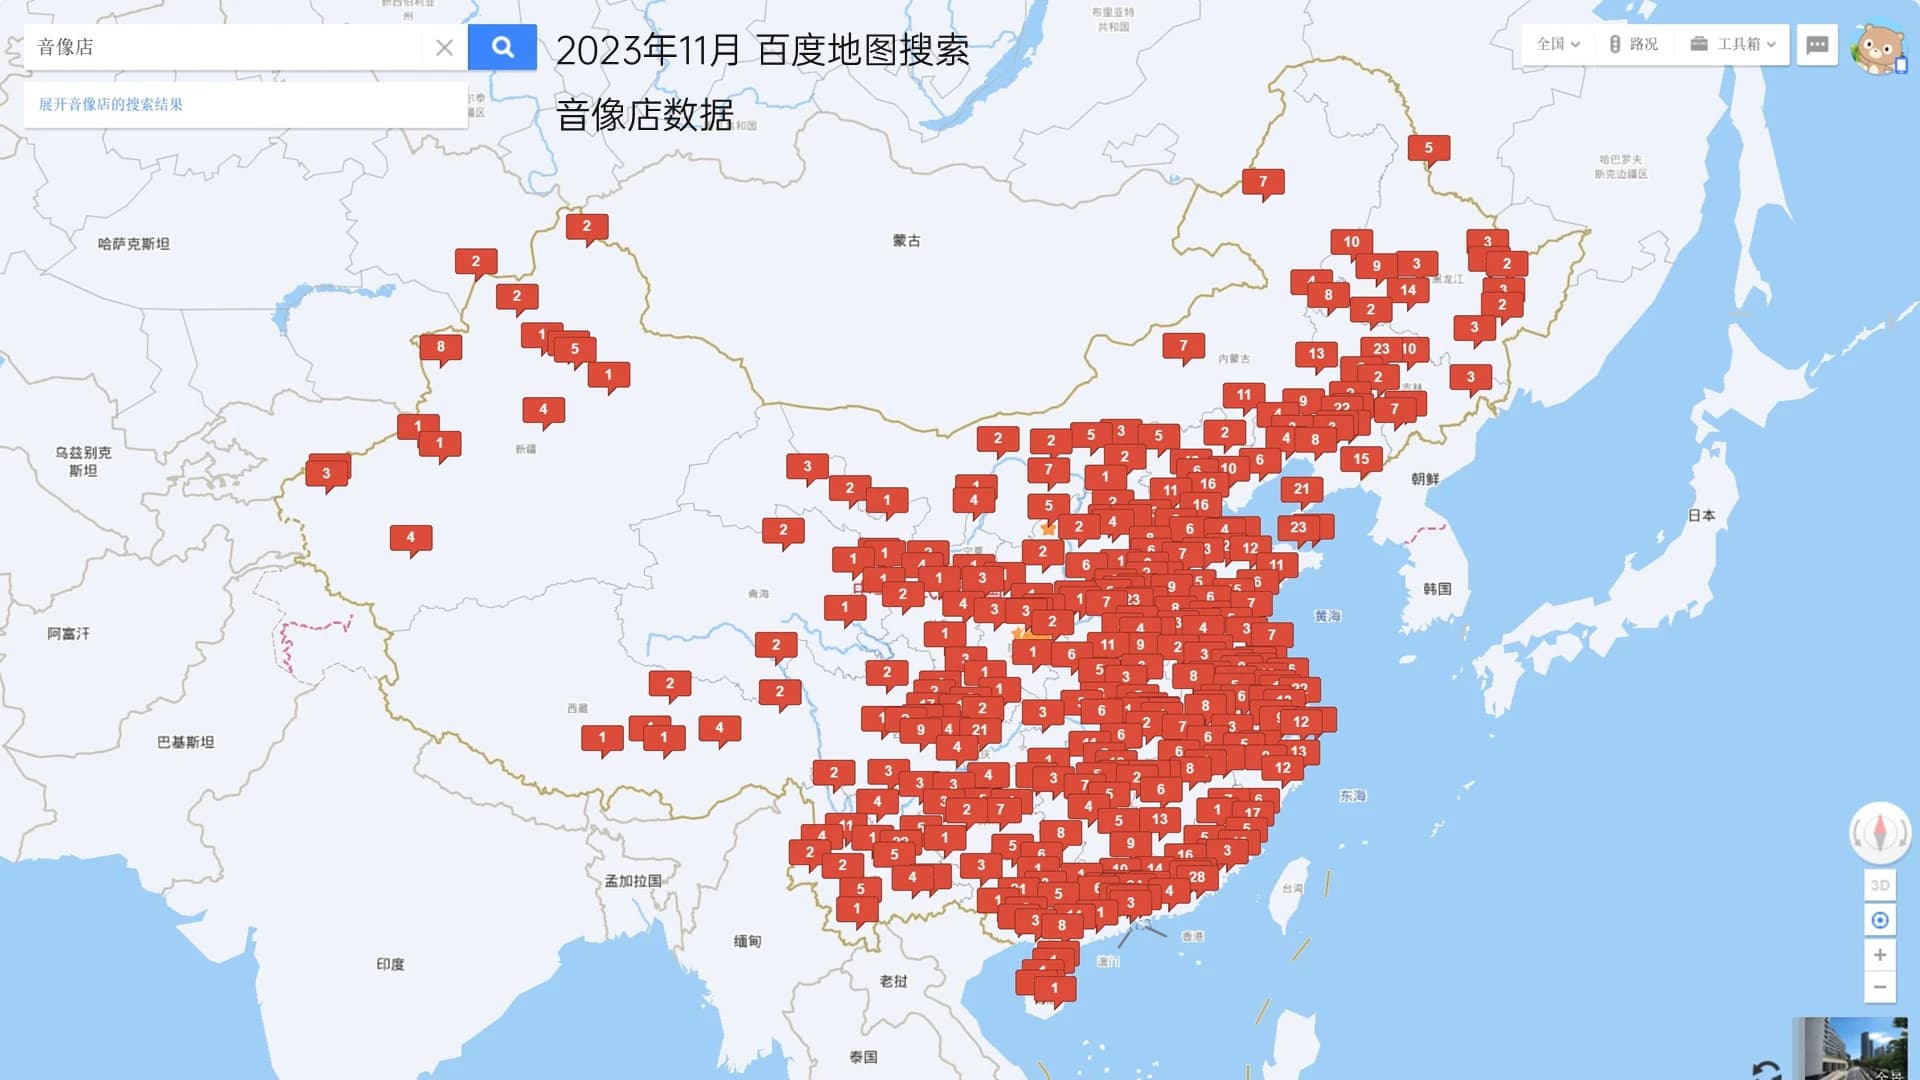
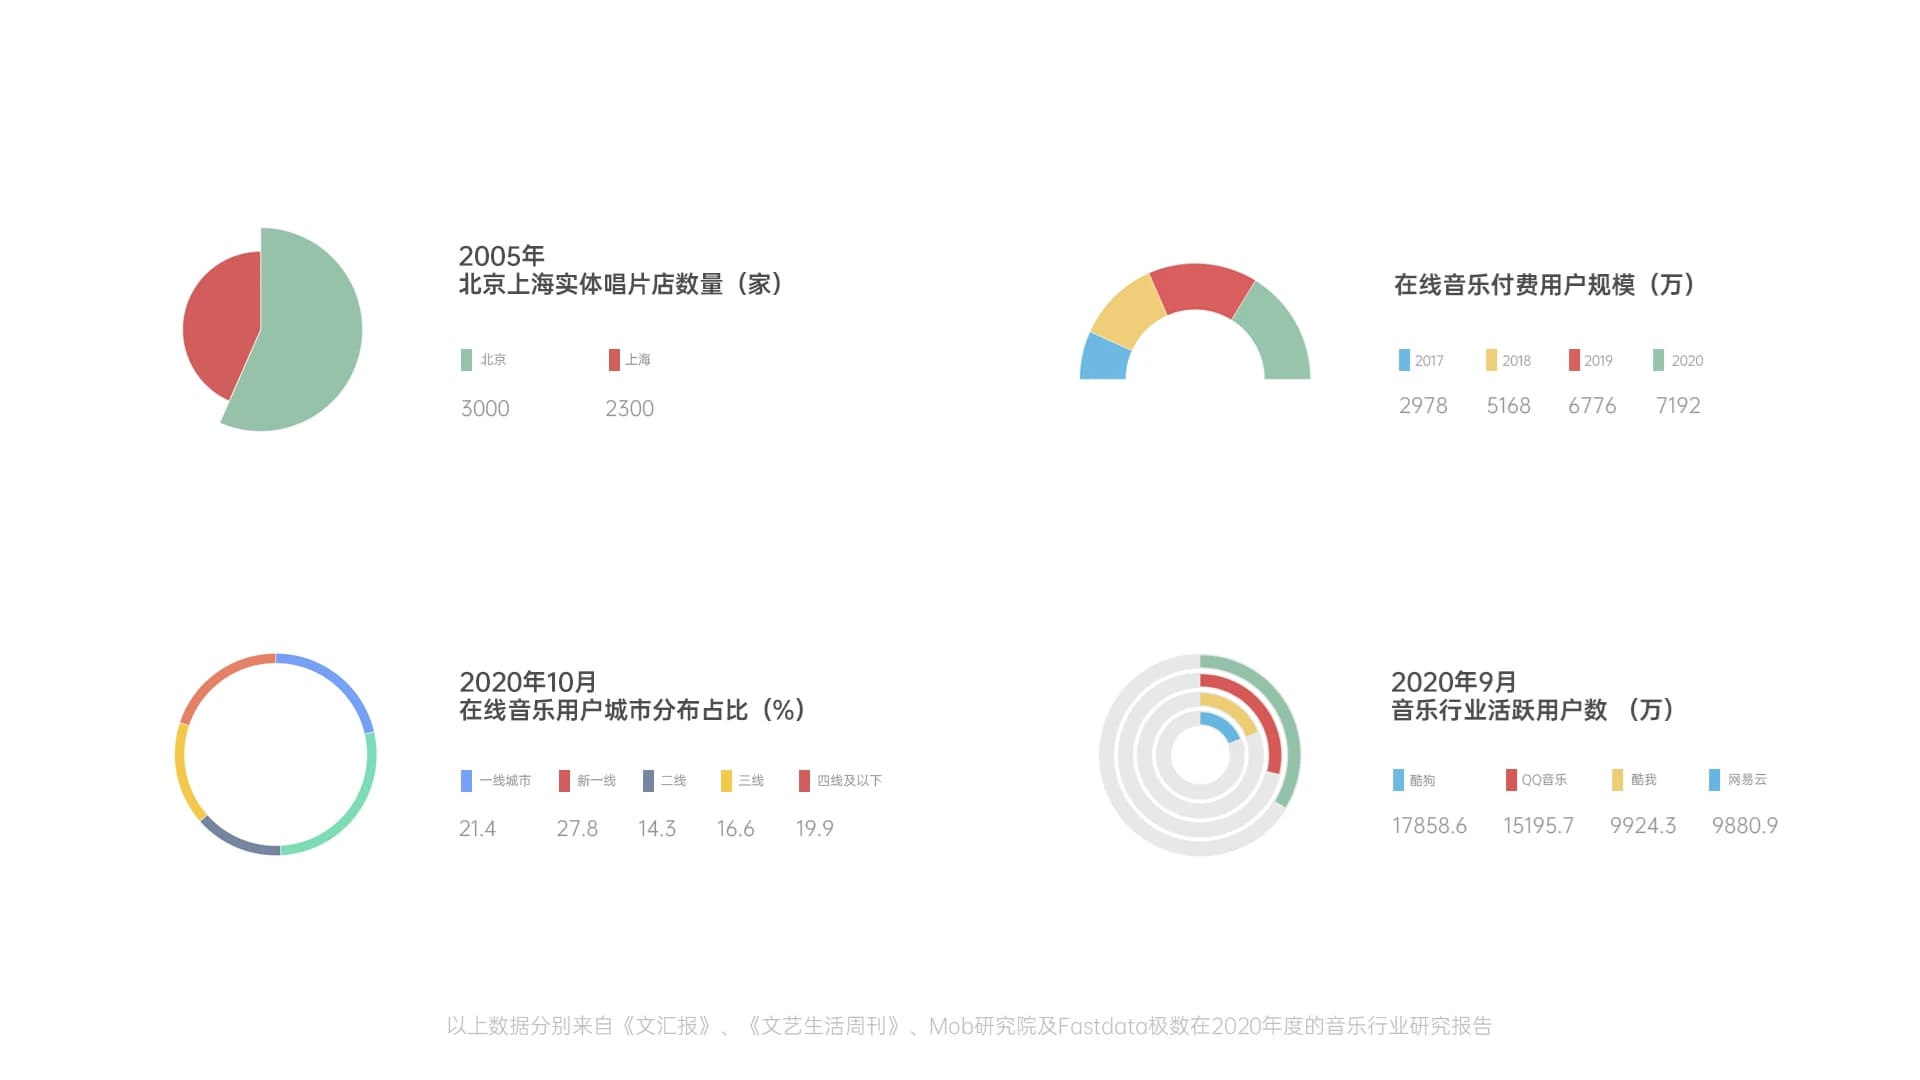
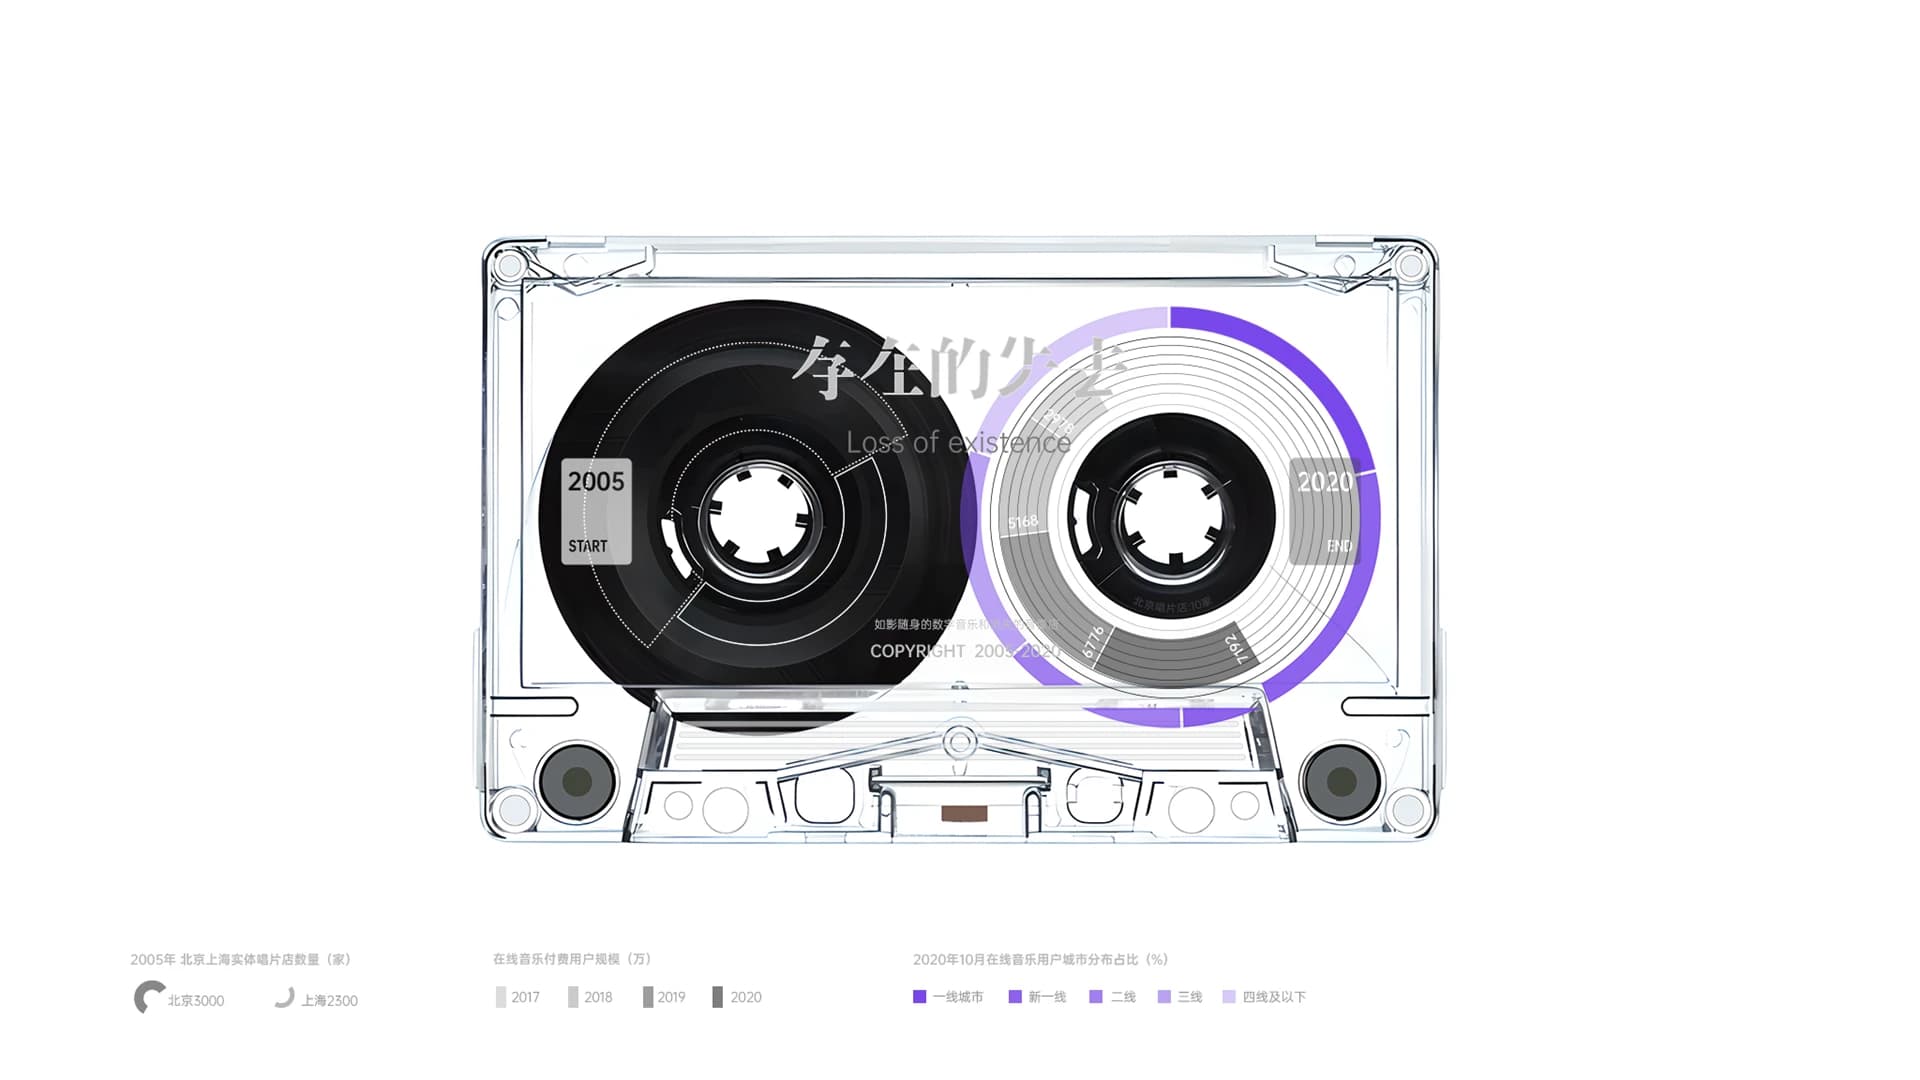
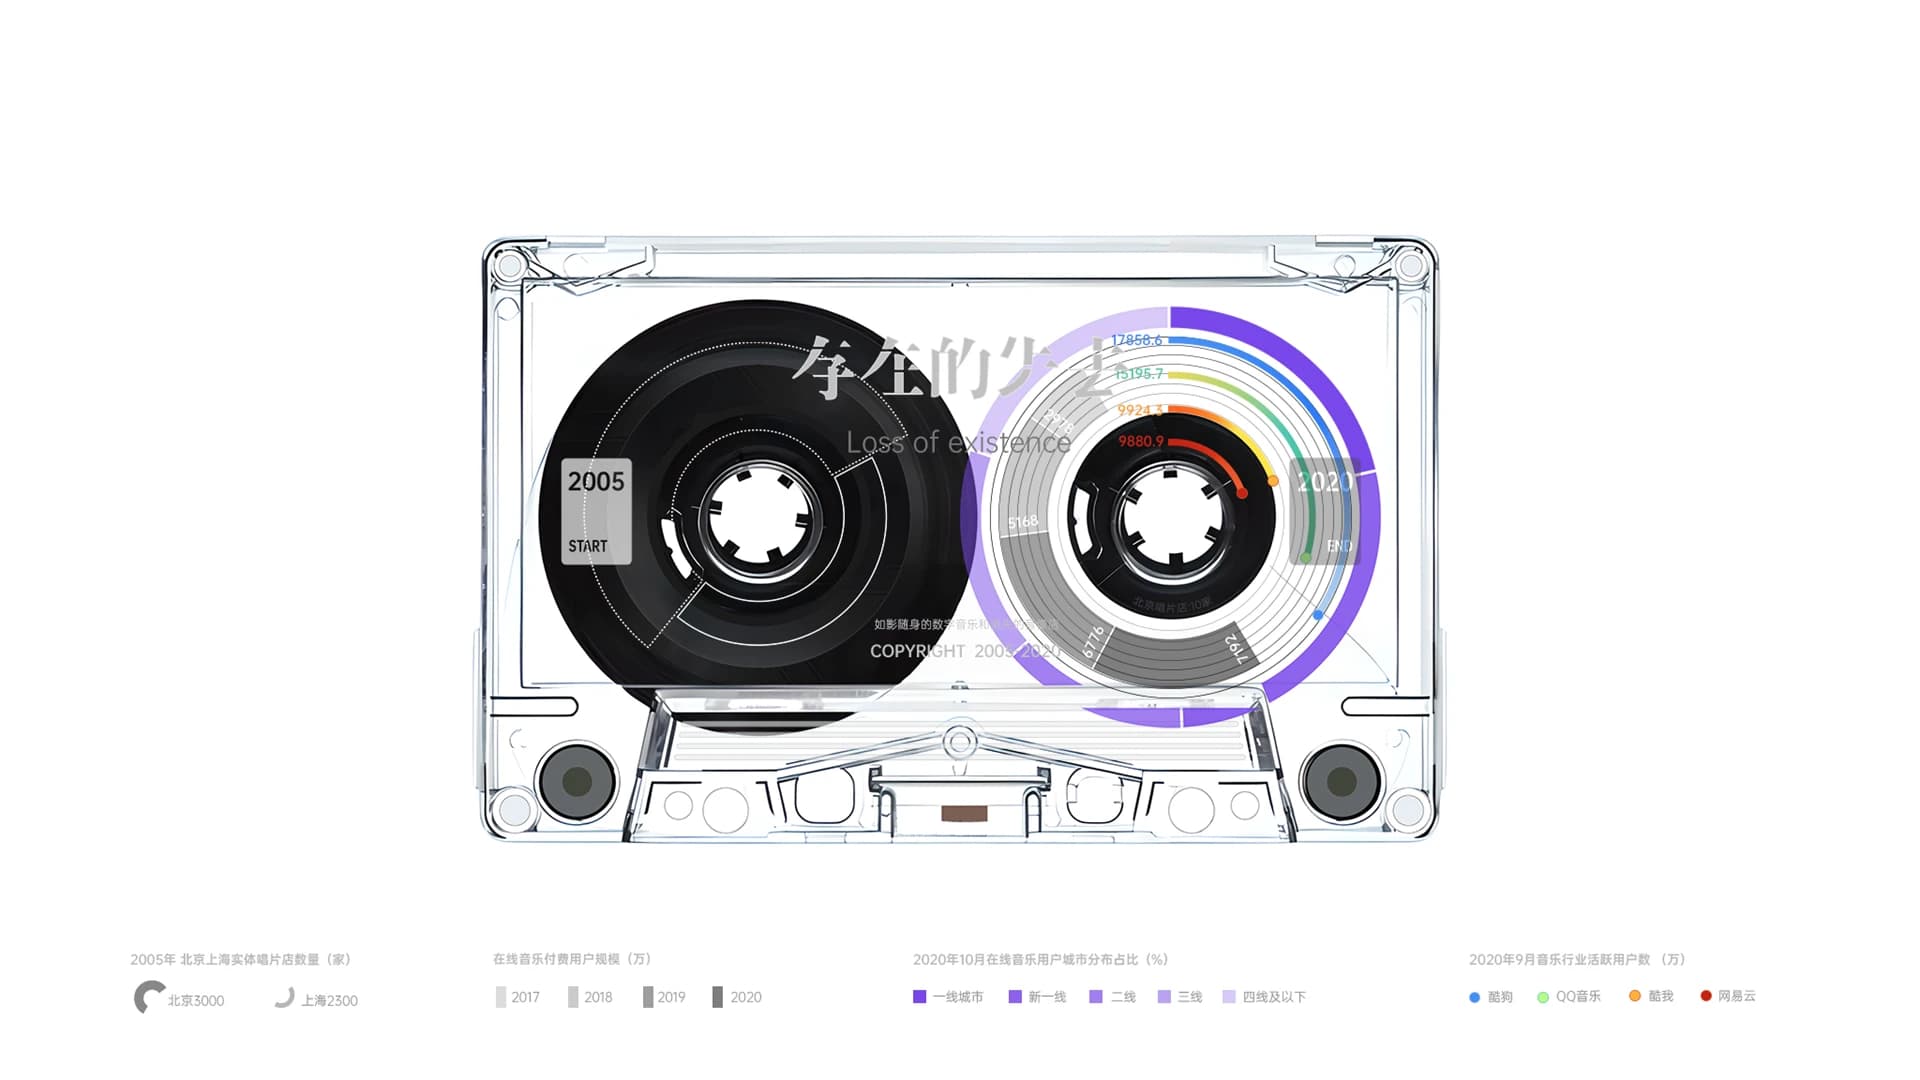
The research assembles evidence from store-search results, physical-store counts, and music-industry reports, tracing the contraction of physical channels alongside growth in paid online listening, urban streaming use, and platform activity. Maps and charts are not the destination here. They establish that the change happened, so the design can ask how its cost might be made visible.
03 / NARRATIVE VESSEL
Choose the cassette because it already makes time visible
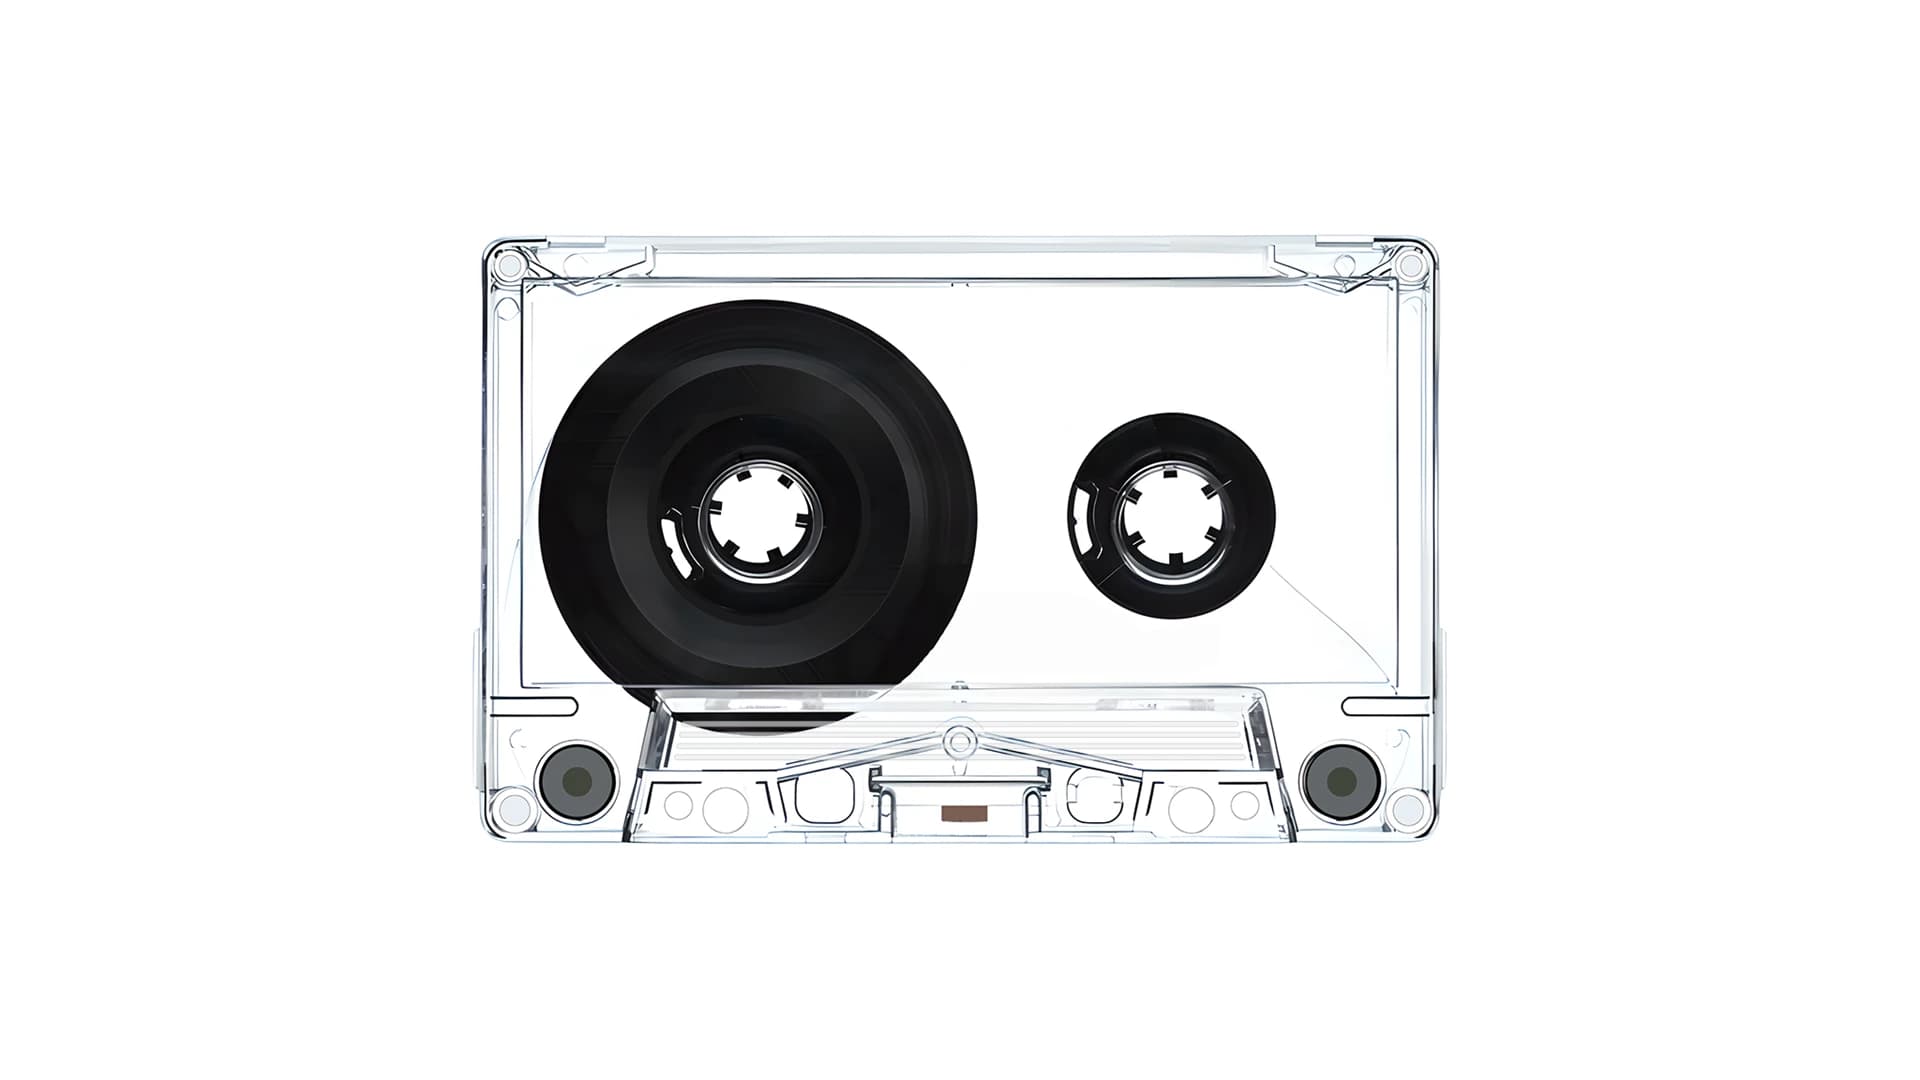
A cassette has two adjacent reels, a clear front and back, and a visible process of winding. It naturally holds two opposing trajectories: a receding world of physical music on one side, and expanding digital-music data on the other. Its transparent shell preserves the object's structure while giving abstract information a concrete, familiar place to live.
04 / DATA ENCODING
Wind, accumulate, and read data as if it were tape
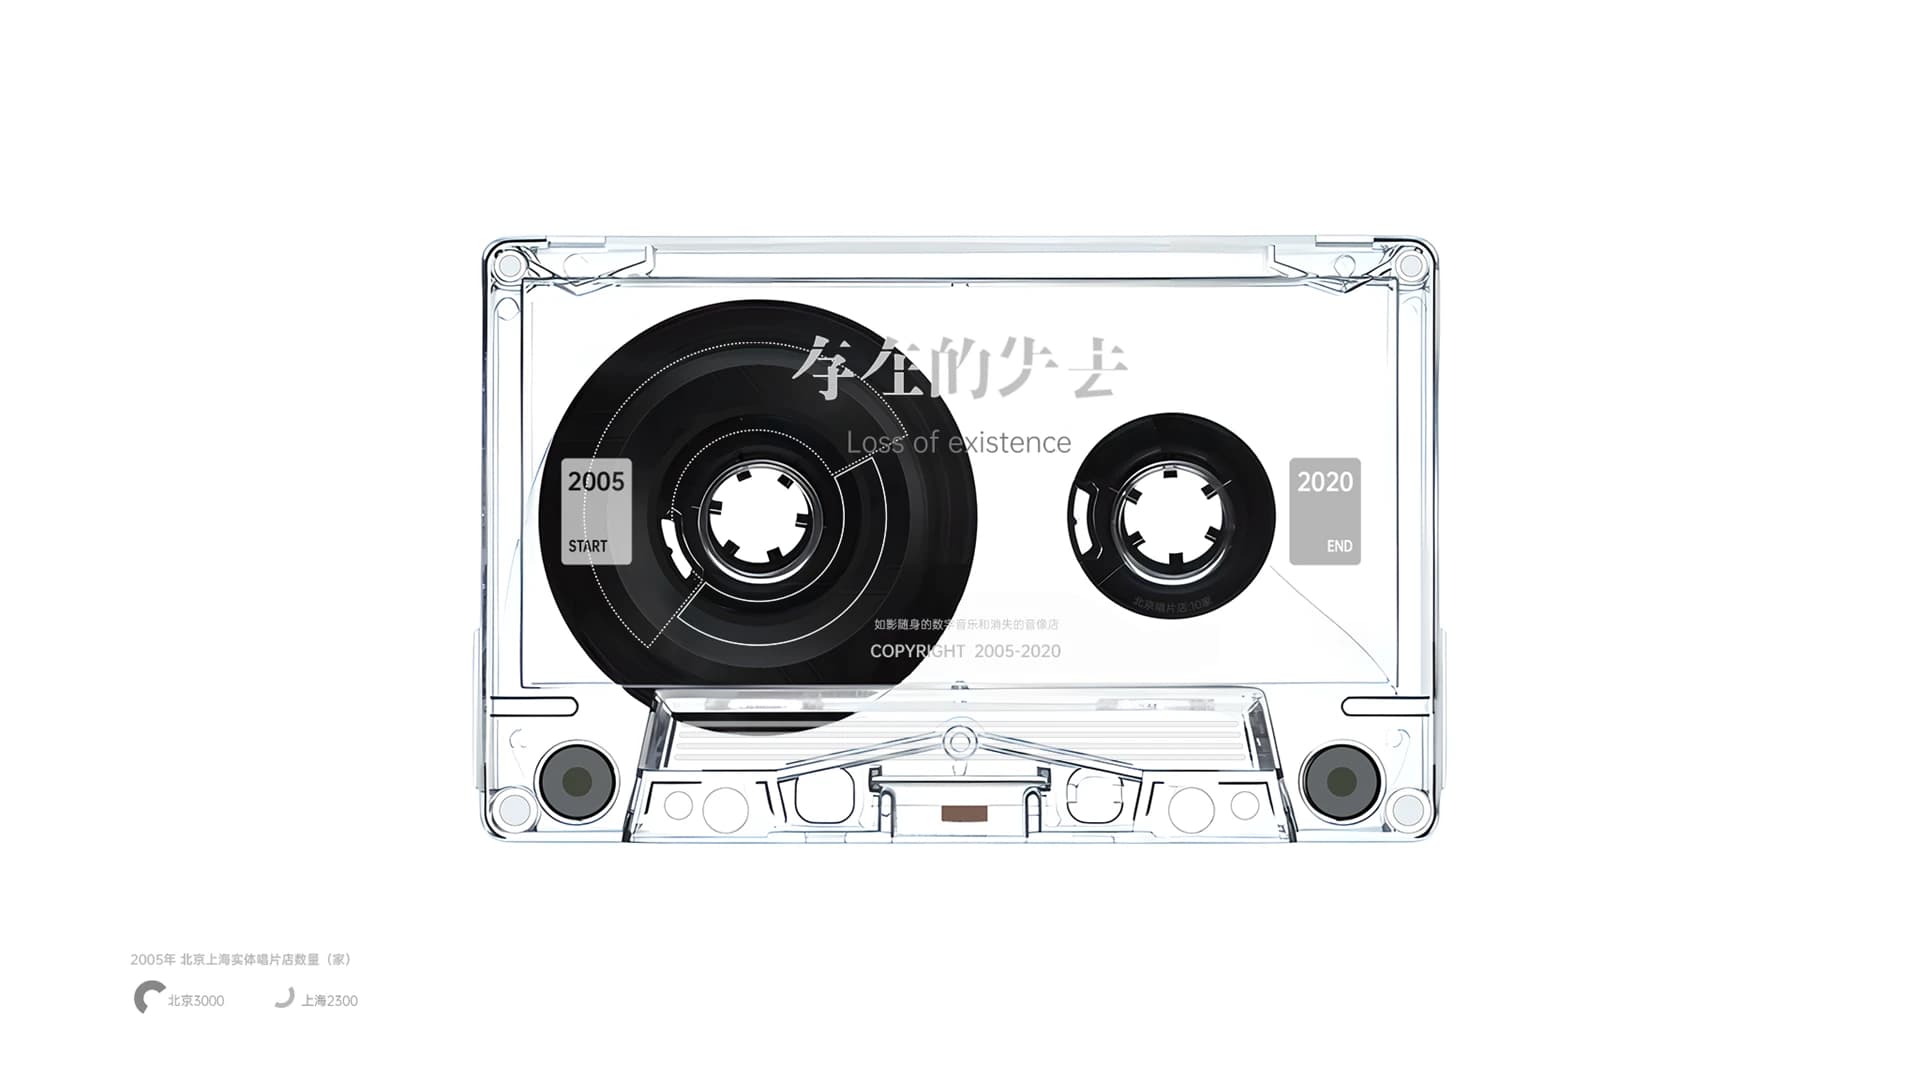
Rather than separating metrics into unrelated charts, the design writes them into the right reel layer by layer. Information about record stores, paid online listeners, city-level streaming, and music-platform activity becomes arcs, color bands, ticks, and labels with continuous visual density. The dark physical record at left and the increasingly populated data reel at right let disappearance and growth coexist in one frame.
05 / MOTION NARRATIVE
Turn static information into a transition that can be watched
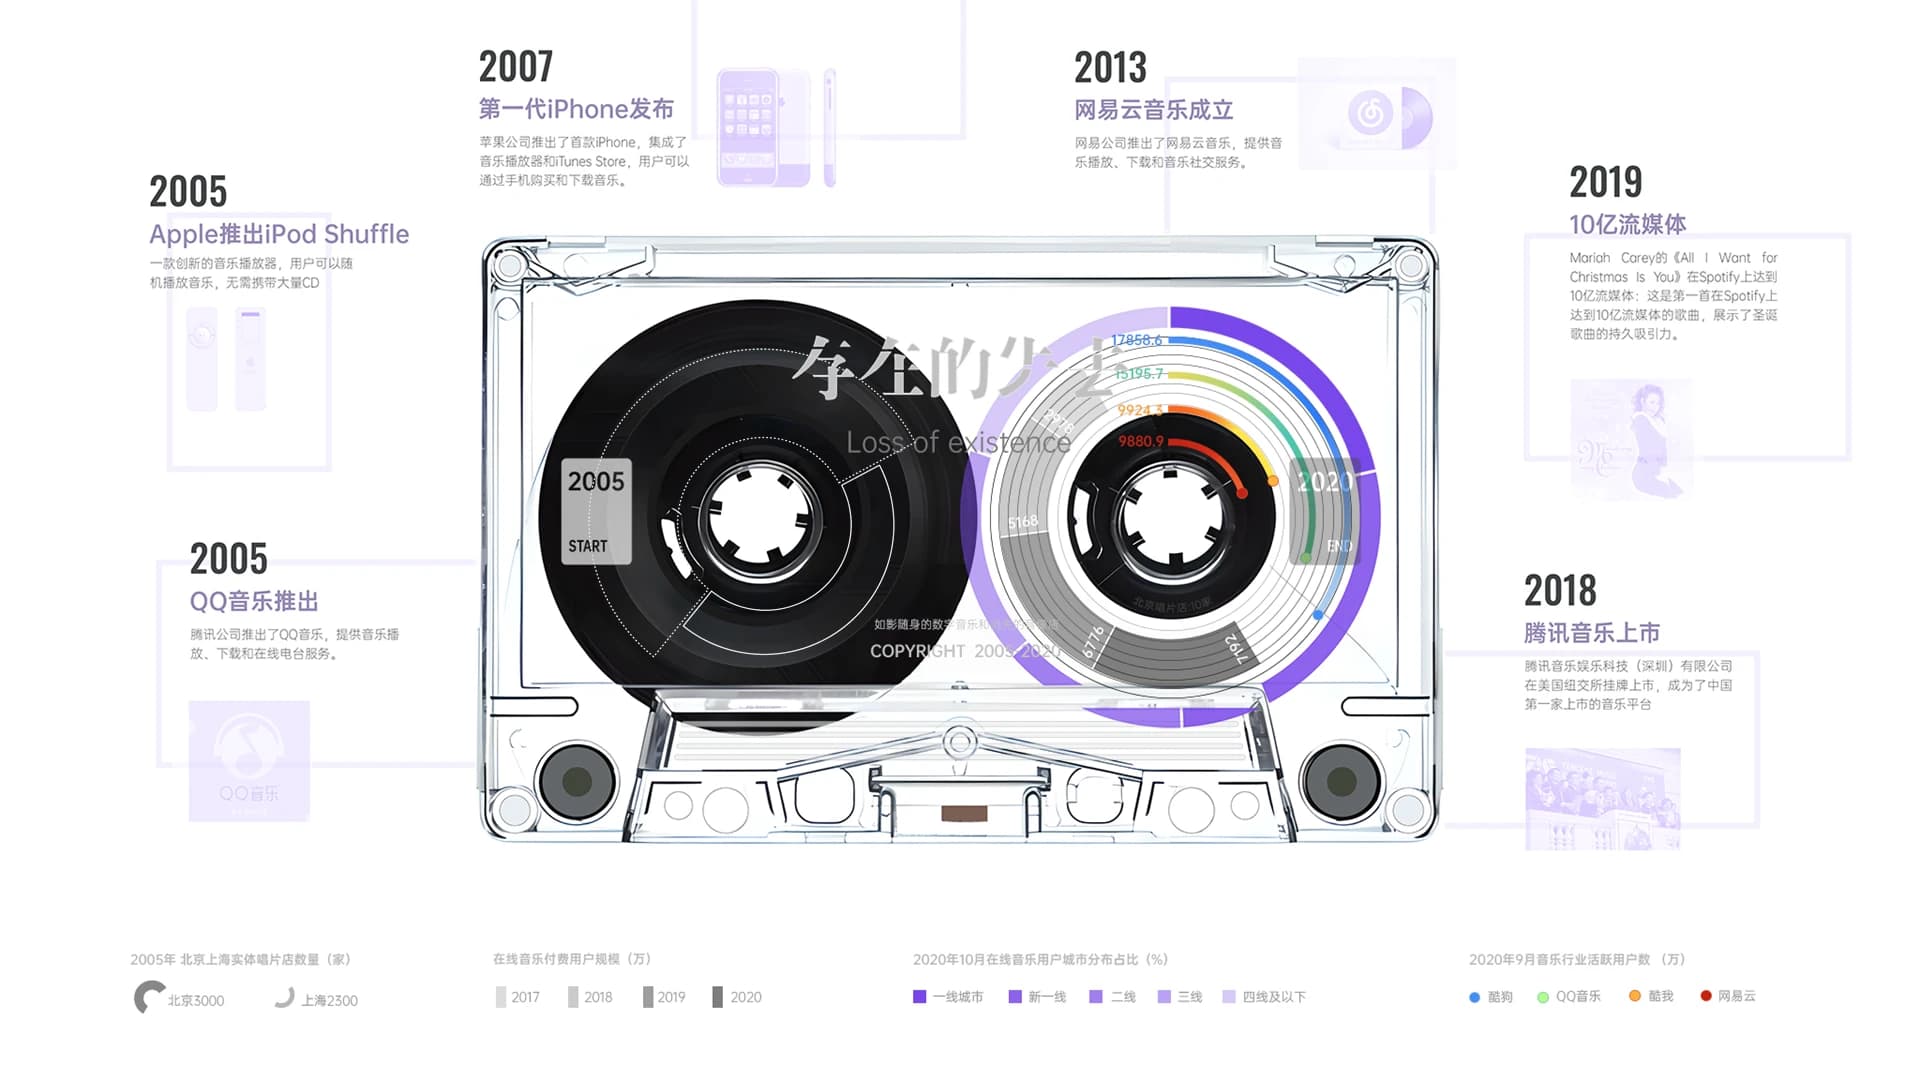
Time markers return around the cassette. Portable players, online music services, streaming hits, and platform products are no longer just text on a timeline; they are events that alter the reel. The final animation lets information emerge year by year, reinforcing the core experience: digitalization is not an instant replacement, but a quiet, continuous shift in how people live with music and objects.
06 / DESIGN METHOD
Design principles
The project treats data visualization as a medium for sensing change, not merely displaying information:
- Find an object with its own memory and structure, then let it become the vessel for data narrative
- Organize distinct metrics as gradual change within one scene instead of a collage of separate charts
- Place data evidence beside sensory experience so an abstract trend can be understood and felt
Next Case
evoo→